
Language Report
The language report captures information about two scenarios:
- When a user navigates to your site with a browser-set language that differs from your site language
- When a user initiates an instant translation by selecting a language from the menu on your site
This data can help you identify which languages are the most popular, find the most commonly translated content, and decide whether or not to translate specific content manually.
The Language Report does not report on AWS overages for translation.
Access the Language Report
Navigate to Site tools > Dashboard > Customer Experience Reports > Language Report.
- The Language report can be accessed by Admin users.
- The report includes export options to download or email the data.
Report components
Export options
All of the export options can be found in the Dashboard Actions menu.
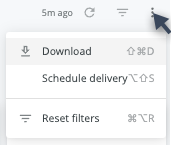
- Download as:
- CSV
- Schedule Delivery (email reports instantly or on a schedule)
Filters and Reload
- Date: Date range for the reporting period
- Date View: Day, Week, or Month
- Group: Enter a group name to filter results for that group only. Multiple groups can be selected.
- User Type: Anonymous, Community (Authenticated Viewer), or Pro (Seated)
- Page Location: Narrow down the report by entering a path or selecting from the menu.
- Translated Language: The language users translated your site into via instant translation
- Preferred Other Language: The users' browser-set language, if different from your site's language
- Engagement Channel: For example, direct, referral, or Touchpoint
- Filter Unknown Browsers - Selected by default, and excludes bot traffic from report results.
- Reload
 : Refreshes the report with the selected filters applied
 - Show / hide filters
 : View or hide the filter options
 - Reset filters option (located in the Dashboard Actions menu)
Data
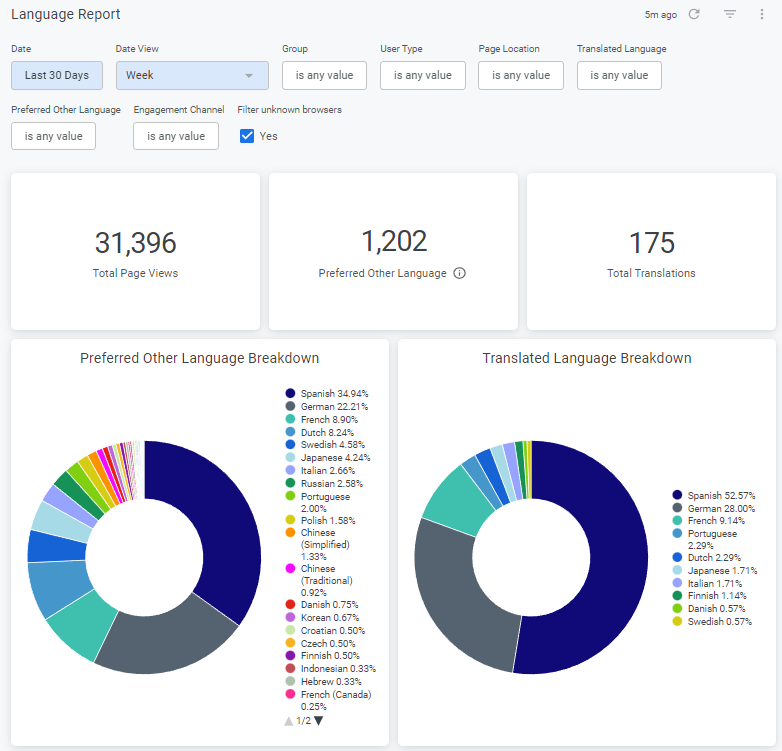
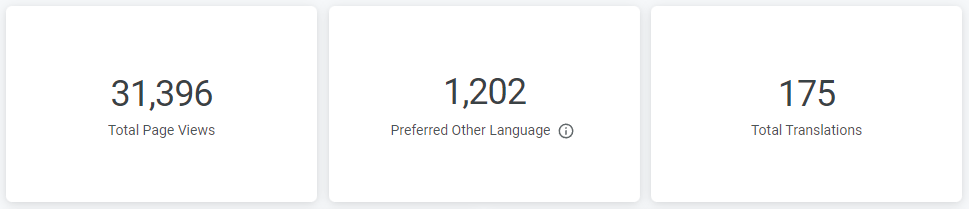
Language Report Overview
Format: Tiles
- Total Page Views
- Preferred Other Language: A count of page views in which the user's browser-set language differs from your site's language.
- Total Translations: A count of how many times users initiated an instant translation using the drop-down menu on your site.
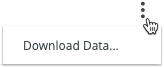
Interaction options:
- Hover over a tile to show and click 3 dots menu for Download Data options
Preferred Other Languages
Format: Doughnut chart of any languages visitors have selected in their browser that are not your site's language.
Interaction options:
- Hover over any part of the doughnut chart to see a details popup of specific value.
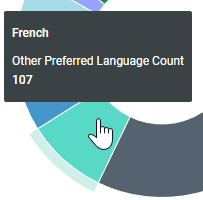
- Click the chart labels to toggle each language off or back on in the doughnut chart.
- Hover over chart to show and click 3 dots menu for Download Data options
Page Views by Translated Language
Format: Doughnut chart of any languages visitors have selected for the site to be translated into using instant translation.
Interaction options:
- Hover over any part of the doughnut chart to see a details popup of specific value.
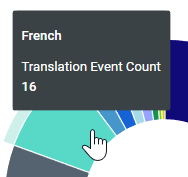
- Click the chart labels to toggle each language off or back on in the doughnut chart.
- Hover over chart to show and click 3 dots menu for Download Data options
Engagement Languages Over Time
Format: Line chart with 2 lines, one for translated languages and one for preferred languages.
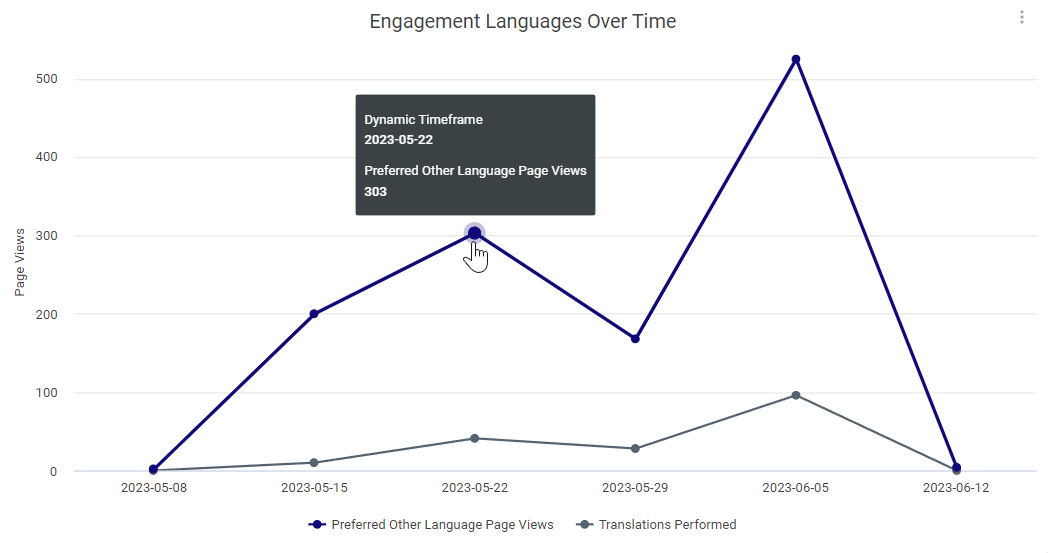
Interaction options:
- Hover over a point to view the timeframe and information for that point (either views in preferred other languages, or translations performed, depending on which line the point is on).
- Hover over chart to show and click 3 dots menu for Download Data options
Translated Languages Over Time
Format: Vertical bar chart, with each language represented by a different color.
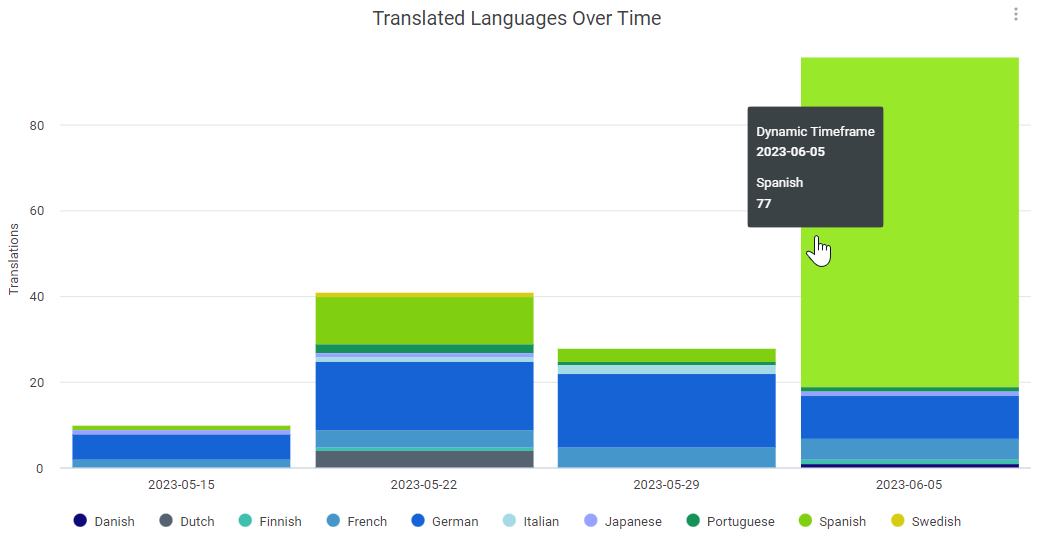
Interaction options:
- Hover over a point on a line to see the timeframe and details for that point.
- Hover over chart to show and click 3 dots menu for Download Data options
Top Preferred Other Language Articles
Format: Horizontal bar chart, with each language represented by a different color. The pink section at the end of the bar represents the total count of all languages combined.
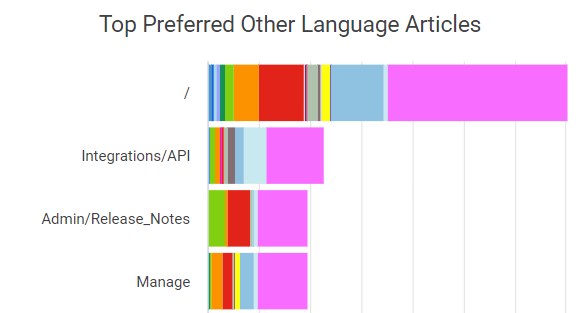
Interaction options:
- Hover over a section of the chart to display the timeframe, language, and count.
- Hover over chart to show and click 3 dots menu for Download Data options
Top Translated Articles
Format: Horizontal bar chart, with each language represented by a different color. The orange section at the end of the bar represents the total count of all translated articles combined.
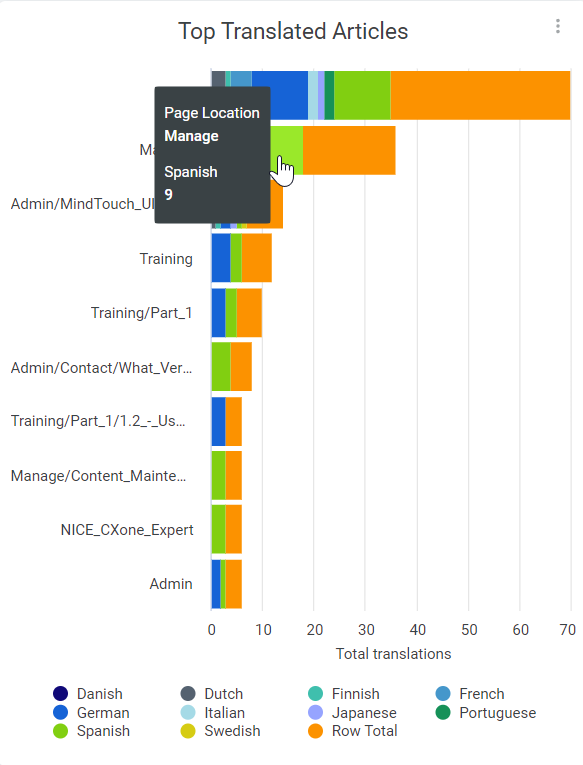
Interaction options:
- Hover over any color to see the language, page location, and total translations into that language.
- Hover over chart to show and click 3 dots menu for Download Data options
Engagement Language Metrics
Format: Table
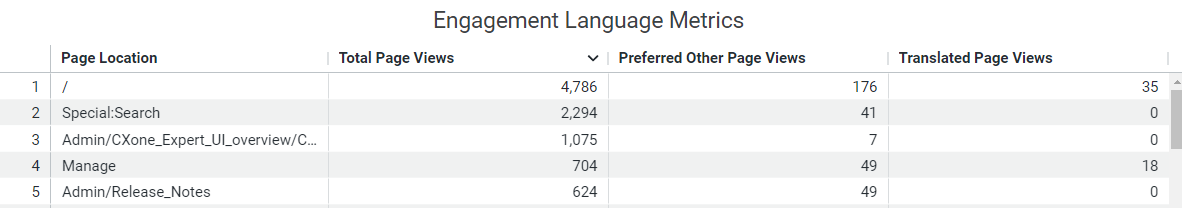
Data columns:
- Page Location: Article path
- Total Page Views (default order, largest to smallest)
- Preferred Other Page Views: Page views where user's browser language doesn't match the site language
- Translated Page Views: Page views where a translation was performed
Interaction options:
- Hover over any color to see the language, page location, and total views in that language.
- Hover over chart to show and click 3 dots menu for Download Data options
Use the data
An increase in translated or preferred languages over time is an indicator that customers in different countries or with different language preferences are using your site more than before. Using the Language Report can help inform discussions centered around:
- When to add new language options to your site
- Whether certain languages or pages need to be translated manually
- How to prepare content for a more global audience
Consider human translation
- When the origin language and the translation language are not read in the same direction
For example, going from English (LTR) to Arabic (RTL) - When there is demand for a language, but machine translation is not accurate enough