Analyze queries with Search Insights report
- Applies to:
- CXone Mpower Expert (current)
- Role required:
- Admin
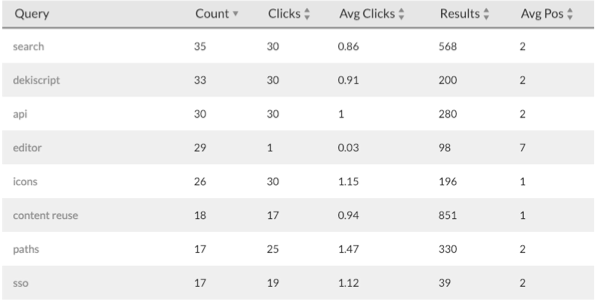
The Search Insights report includes a Top search queries table to highlight high-level metrics for search queries:
- Query: The term entered for the search.
- Count: The number of times that particular query was performed within the selected timeframe of a report. If a user clicks a result after searching and then immediately repeats the same query, it is grouped in the same search period.
- Clicks: The total number of times any page or pages were clicked in the search results for that particular query.
- Avg Clicks: The average amount of times any page or pages were clicked within a search period. This value can help you measure the quality of search results.
- Results: The number of pages returned in the search results. This value can help identify queries with highly dense search results.
- Avg Pos: Among the results of a query, the average position of the pages clicked. This value provides a measurement of the performance of your articles in terms of search relevancy. The higher the rank, the more quickly users find the appropriate article. This column will not help you find gaps, but poor performing yet valuable articles.

Apply filters to adjust the data to specific sources, user types, timeframes, and keywords.
Analyze top queries to improve search performance
This can tell you what searches are performing well, and what searches are missing their mark. Below, you will find a breakdown of the various tools available to you within the query detail view of your user searches. These tools can help you gain further insight into the performance of that search, broken down by your user base.
Understand query details
To gain further insight into search performance you will want to dive into the query detail. You can click each query to drill down and find more information about what pages are clicked for that particular search. You will also be able to confirm what gaps you have in documentation along by looking at which pages your users are clicking.
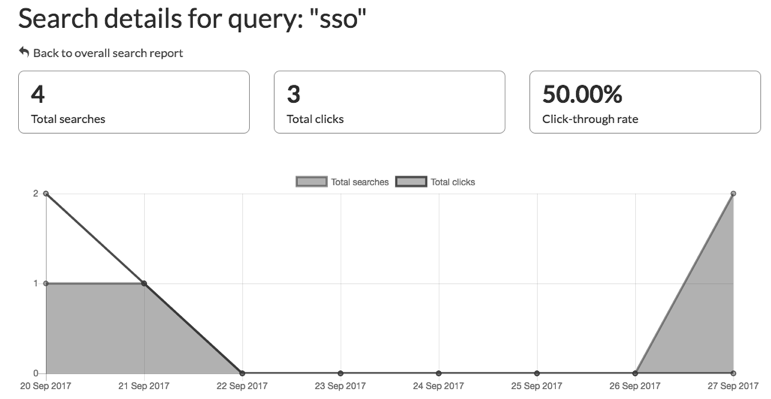
The query-specific view includes high-level Search details for query and Top clicked results data.
Search details for query
- Total searches: Number of times that particular query was searched in the given time period.
- Total clicks: Number of times an article was clicked when that search was performed.
- Click-through rate: Percent of times each search session resulted in at least a single article click.

Top clicked results
Discover what content is being leveraged by your users. In this table you will see all the articles clicked when that query is searched, taking into account the time frame and other filters that have been applied.
- Star: If the star is filled in that page is a recommended page for that specific search query. This will help you further understand how well your recommended searches are contributing to your user's search experience.
- Clicked Results: The actual article that was clicked. You can click the article to gain further insight into what information that article contains. It will open up in a contextual help dialog so you can read the article in context to the report.
- Clicks: The number of times that article was clicked for the given query and the filters applied.
- Rank: Average position of the article when it is clicked in relation to the search query. Position can vary based on page permissions and search filters such as hierarchy faceting. This can help give you an idea regarding that query's performance. If you users have to drill further down the results to find what they need you may want to boost that article to the top either via search engine optimization or a recommended search.
- Last clicked: The most recent time the article was clicked for that query. You may have a highly clicked article but if it has not been clicked lately it may be due to the fact it has become stale or has been supplanted by new articles you've written.


