Session Insights Report
The Session Insights Report tells you when and where a visitor lands on your site, how much time they spend per session, and where they exit your site. When analyzing user behavior during their session, you may be able to:
- Locate friction points in your site
- Understand why some customers move through the content framework quickly in comparison to others
- Detect why some customers don’t engage with your content
- Identify reasons why customers leave your site
- Determine if there is missing information that customers need to see on your site to accomplish their goals
Access Session Insights Report
Navigate to Site tools > Dashboard > Customer Experience Reports > Session Insights Report.
- The Session Insights report can be accessed by Admins and certain users with special permissions.
- The report includes export options to download or email the data.
Report Components
Export Options (gear icon  )
)
- Download as PDF
- Download as CSV
- Send (email reports immediately)
- Schedule (email reports on a schedule)
Filters and Run
- Date
- Date View
- Group
- User Type
- Engagement Channel
- First Page Path
- Last Page Path
- Exclude Bot Traffic
- Run button (Not shown)
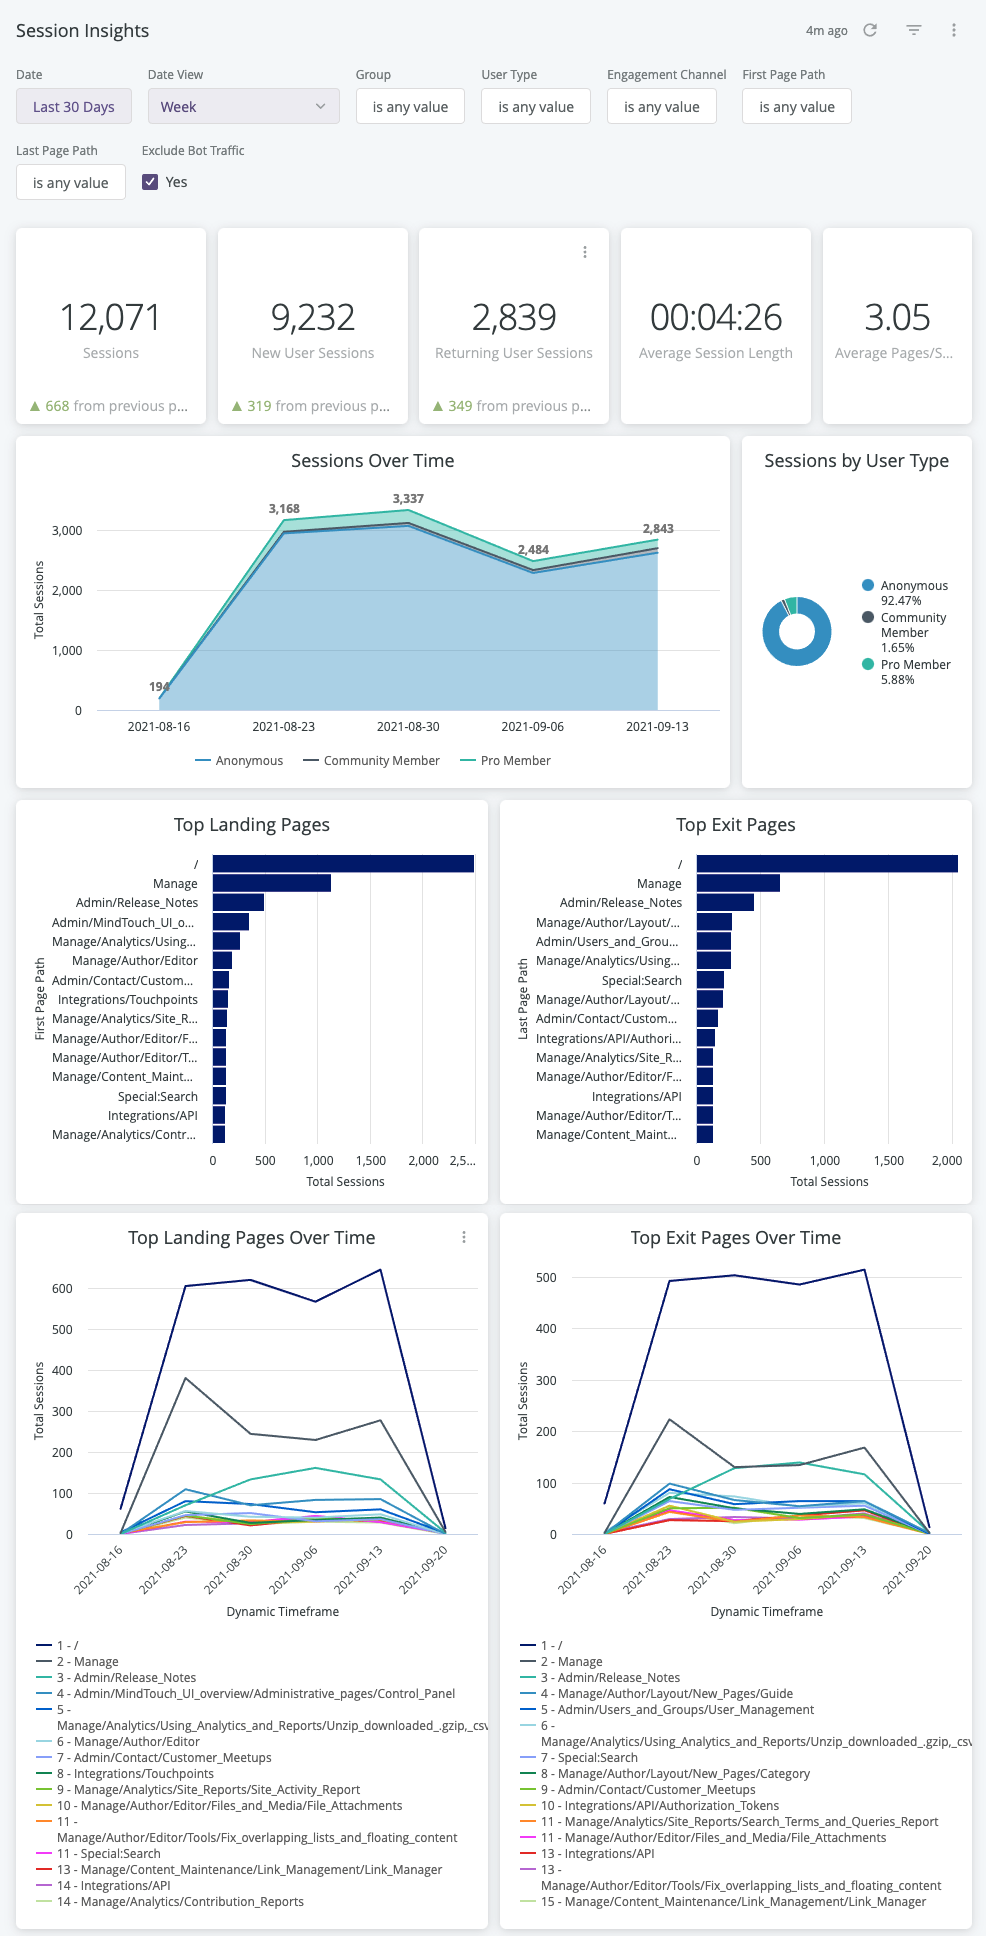
Data
Overview
Overview tiles show total sessions count, new user sessions, returning sessions, average session length, average pages per session (within the date time selected in the filters panel).
- New users are new to the site for the indicated time period only.
- Returning users are users who have been to the site more than once, regardless of the time period selected.
- The "previous period" is for the previous date range that is selected. For instance, for the selected date range of Jan 2023 to July 2023 (6 months), the previous values are from July 2022 to Dec 2022.
Returning users are recognized by their browser cookie. Browser cookies expire after 6 months of inactivity and may be cleared by an end-user at any time, causing the user to be considered new.
Interaction Options:
- Hover over a tile to show and click the 3 dots menu for Download Data options.
Sessions Over Time
Sessions over time allows you to view the changes in sessions over time, determined by the date time selected in the filters panel. You can compare the sessions over time between user types: Anonymous, Community Members, and Pro Members.
Interaction Options:
- Hover over a tile to show and click 3 dots menu for Download Data options.
- {add any additional interactions}
Sessions by User Type
View the breakdown of user types for all sessions within the filtered time range. The user types are Anonymous, Community Members, and Pro Members.
One user can account for two different types of sessions. For example, if a user starts browsing in an anonymous session (without being logged in) and then they log in, the Anonymous session ends and a new Community Member or Pro Member session begins. You can find more info about sessions in this article.
Interaction Options:
- Hover over a tile to show and click 3 dots menu for Download Data options.
- {add any additional interactions}
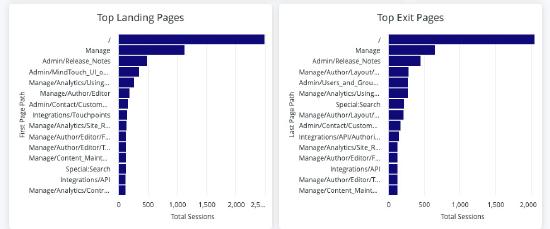
Top Landing and Exit Pages
Bar graph displaying the top landing pages and top exit pages based on sessions.
Interaction Options:
- Hover over table to show and click the 3 dots menu for Download Data options.
- {add any additional interactions}
Top Landing and Exit Pages Over Time
Multi-line graph showing the top landing pages and top exit pages per session over time.
Interaction Options:
- Hover over table to show and click the 3 dots menu for Download Data options.
Filter Tips
- Auto-suggest: For Group, User Type, and Page Location filters, click into each filter field with is equal to (default) filter type selected to trigger the auto-suggest options before using other filter types.
- Filter field entries: Ensure selected filter field entries are accepted with grey background before clicking Run. Filter field entries are case sensitive.
Considerations
- The data for this report is current through each previous day due to nightly data processing.
- Depending on query size, data may take up to a minute to load. A spinning wheel indicator will appear until each data component loads and the Stop button will change to Run when all components complete loading.
- Data settling period: The data for the most recent previous day should be considered incomplete and will likely increase (usually by less than 1%) the following day.
- The report times out after 1 hour of inactivity - refresh browser to reconnect or see 401 error troubleshooting.
- Report labels are not localized on non-English NiCE Knowledge Management sites.
- The report service, powered by Looker, has weekly maintenance hours when reports may be unavailable.
- Sunday and Wednesday: 4am-6am UTC (9pm-11pm Pacific)
Report details
The report is downloadable as a set of CSV files that include the data available in the UI report. Following is a table of the data and how it is calculated:
| Data | Description |
|---|---|
| Sessions | Distinct count of all sessions |
| New User Sessions | The user is new for the time period specified. This includes all user types. |
| Returning User Sessions | The user is new for the time period specified. |
| Average Session Length | Average difference in seconds between session start and end |
| Average Pages/Session | Count of page IDs viewed each session |
| Sessions Over Time | Session count over time period selected |
| Sessions by User Type | Session count for each user type |
| Top Landing Pages | The first page users reach when sessions start |
| Top Exit Pages | The last pages users access before sessions end |
| Top Landing Pages Over Time | Session count over selected time period, where count is greater than 0 |
| Top Exit Pages Over Time | Session count over selected time period, where count is greater than 0 |