Help Request Usage Report
Based on Help Request activity, the Help Request usage logs show how often your site content is used.
- Administrators can see if they are staying within their allotted license usage and gauge how NiCE KM is being used.
- Company executives gain insight into the value their company creates with daily reporting on usage.
- Success managers can obtain metrics for measuring help delivered to your users (Help Requests).
Access the report
Navigate to Site Tools > Dashboard > Site Reports > Help Request usage.
Report details
Report chart will only contain one year's worth of data. To change the report year, please contact the NiCE KM Support Team.
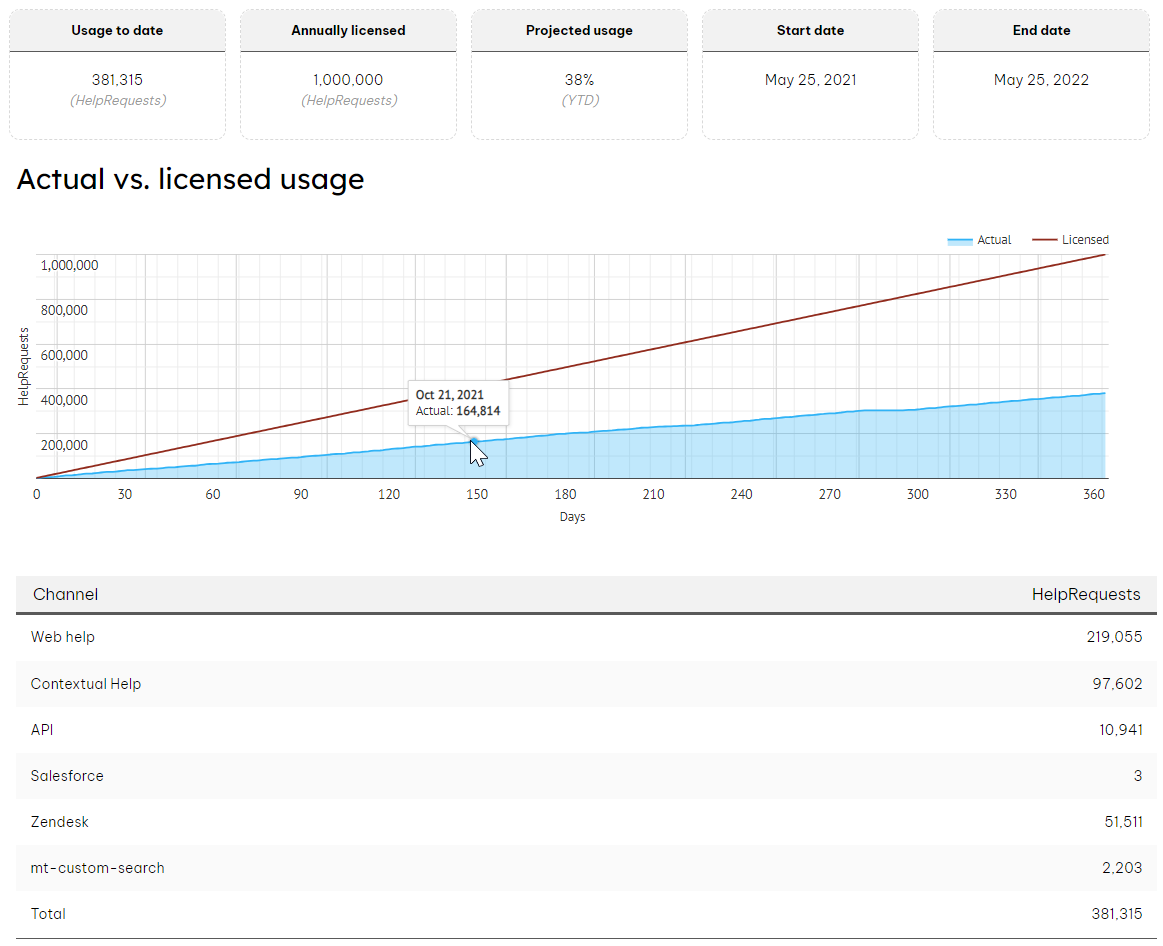
- Usage to date: How many Help Requests have been generated on your site since the start date of your license.
- Annually licensed: How many Help Requests available to you in your license.
- Projected usage: How many Help Requests you are calculated to use by the end of your license date.
- Start date: Beginning date of your license.
- End date: End date of your license.
- Actual vs. licensed usage chart: Compares your sites actual Help Request usage with your licensed usage amount.
- Channel table: Lists the different channels that generated Help Requests for your site.
- Web help: View and search article / PDFs
- Contextual help: View and search within a contextual help box
- API: Any custom requests that have an origin
- [Additional rows]: Custom configured channels appear on separate rows, such as Touchpoints, Salesforce, Zendesk.
- Total: Total count of Help Requests from the above list.
How does this report compare to the Google Analytics reports?
You may see higher numbers in the NiCE KM usage report than in your Google Analytics report for three reasons:
- Along with page views, NiCE KM also tracks PDF views and searches to provide a more comprehensive NiCE KM help experience insight.
- You may have set up IP filtering in your Google Analytics account. These requests are not filtered with Help Requests.
- Help Requests are a more thorough and direct analysis of the usage of your NiCE KM site based on data directly from our API. Google Analytics do not track API usage.
Download the Help Request Usage report
If you do not see an option to download the report, contact the NiCE KM Support Team.
- From the Help Request Usage report, scroll down to the Report download section.
- Select a month from the dropdown menu and click Download.
- If needed, unzip the file to open it.
Logs are updated at the end of every day and are delivered in .csv format. The logs contain information on every Help Request that occurs on your site. You may also download the log for the current month up to the previous day.
Log details
The audit logs contain requests that NiCE Knowledge Management counts as Help Requests.
- event_id: Unique identifier for this particular Help Request. Identifies a particular Help Request. Can be used to reference a particular Help Request with NiCE KM.
- event_datetime: The exact date on which the event occurred. Dates are always in the UTC timezone. The format is MM/DD/YYYY HH:mm.
- event_user_is_anonymous: True (t) if the user is anonymous. False (f) if the user is logged in.
- event_session_id: A cookie is stored in the user's browser to identify the user whether or not the user logged in. Used to track a particular user across multiple requests.
- event_page_id: A number that functions as a unique page identifier.
- event_parameter_origin: A parameter used to capture the origin of the request. The parameter of
example.com/@api/deki/pages/123/contents?origin=CustomIntegrationyields a value of "CustomIntegration." Examples include:- mt-web: The request originated from a browser.
- mt-f1: The request originated from contextual help.
- Blank: The request came from an unknown origin.
- helprequest_origin_type: The classification of the previously mentioned
event_parameter_origin. This buckets the origins to view the collection on a less granular level. Types include:- WEB: The request originated from a browser
- F1: The request originated from contextual help
- CUSTOM: The request came from a custom origin parameter
- INVALID: The origin parameter was deemed invalid
- BLANK: If there is no origin parameter, the origin type will be unclassified
- event_ip: The IP address where the request originated from.
- event_page_path: The page path involved in the request. This is only applicable for page and PDF views. An empty path is used to identify the home page. We recommend using the Page ID to track pages. An author may change the page path, but the ID remains the same.
- event_type: The unique type of event. Values include:
- page:view: The request originated from a browser (the default way your content is viewed).
- page.content:rendered: A page was rendered through the API (a custom integration where your content is viewed on a different property).
- search:query: A search was performed in the NiCE KM interface or the site/search endpoint.
- search:index: A search was performed using Opensearch or using the site/query endpoint. These are likely searches performed by an integration.
- pdf:book: Occurs when a PDF book is generated that contains multiple pages.
- pdf:page: This event shows when a user views a PDF of a page.