Self-Service Report
Before the data for this report will populate, you will need to contact our Support team to turn it on and integrate tracking code on your support ticketing form.
The Self-Service report can help you understand how the content is performing in certain areas of the site. You can then use this information to make targeted improvements.
Learn more about the Self-Service Report
Access Self-Service report
Navigate to Site tools > Dashboard > Customer Experience Reports > Self-Service.
- The Self-Service report can be accessed by Admins
- The report includes export options to download or email the data.
Report components
Export options
All of the export options can be found in the Dashboard Actions menu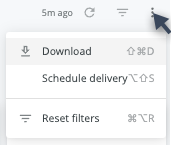
- Download as:
- CSV
- Schedule Delivery (email reports right away or on a schedule)
Filters and Reload
- Date
- Group
- User Type
- Engagement Channel
- Exclude Bot Traffic
- Reload

- Show/hide filters

- Reset filters option (located in the Dashboard Actions menu)
Data
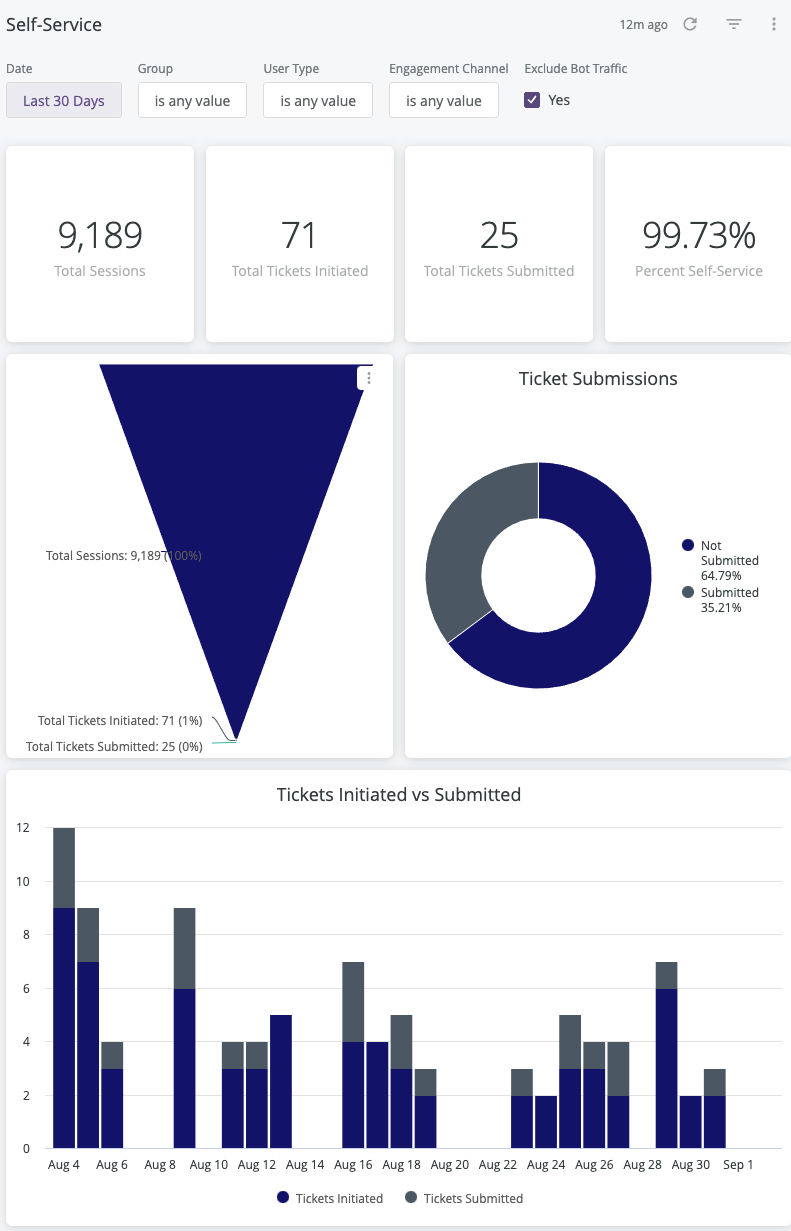
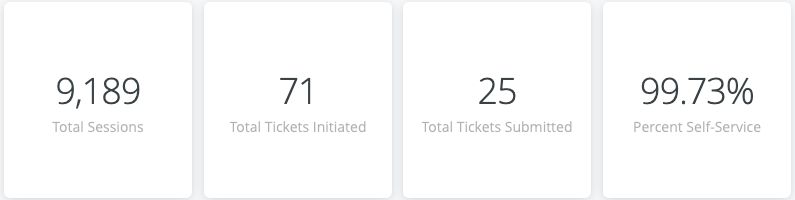
Self-Service Overview
Format: Tiles of Total Sessions, Total Tickets Initiated, Total Tickets Submitted, and Percent Self-Service
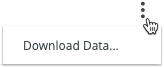
Interaction options:
- Hover over a tile to show and click 3 dots menu for Download Data options
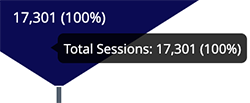
Self-Service Funnel
Format: Funnel chart of Total Sessions, Total Tickets Initiated, and Total Tickets Submitted
Interaction options:
- Hover over chart to show and click 3 dots menu for Download Data options
- Hover over any part of the funnel chart to see a details popup of specific value
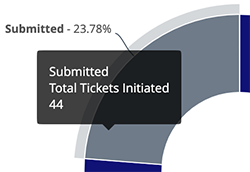
Ticket Submissions
Format: Doughnut chart of Submitted, Not Submitted
Interaction options:
- Hover over chart to show and click 3 dots menu for Download Data options
- Hover over any part of the doughnut chart to see a details popup of specific value
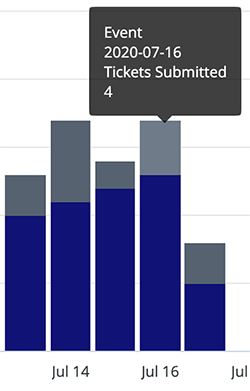
Tickets Initiated vs Submitted
Format: Stacked bar chart of Tickets Initiated, Tickets Submitted
Interaction options:
- Hover over chart to show and click 3 dots menu for Download Data options
- Hover over any part of the bar chart to see a details popup of date and specific value
Filter tips
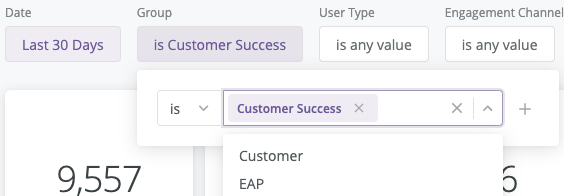
- Auto-suggest: For Group and Engagement Channel filters, click into each filter field with is equal to (default) filter type selected to trigger the auto-suggest options before using other filter types.
- A drop down arrow will appear when the auto-suggest options are available.
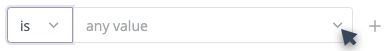
- Filter field entries: Ensure selected filter field entries are accepted with grey background before clicking the reload button . Filter field entries are case sensitive.
Considerations
- The data for this report has been Data tracking for this report begins when it is activated.
- Depending on query size, data may take up to a minute to load. A spinning wheel indicator will appear until each data component loads and the cancel reload button
 will change to the reload button when all components complete loading.
 - Data settling period: The data for the most recent previous day should be considered incomplete and will likely increase (usually by less than 1%) the following day.
- The report times out after 1 hour of inactivity - refresh browser to reconnect or see 401 error troubleshooting
- Report labels are not localized on non-English NiCE KM sites
- The report service, powered by Looker, has weekly maintenance hours when reports may be unavailable
- Sunday and Wednesday: 4am-6am UTC (9pm-11pm Pacific)