Discover trends from Search Insights report
The Search Insights report includes data visualization to help you discover trends and provide an overview of your site's search performance.
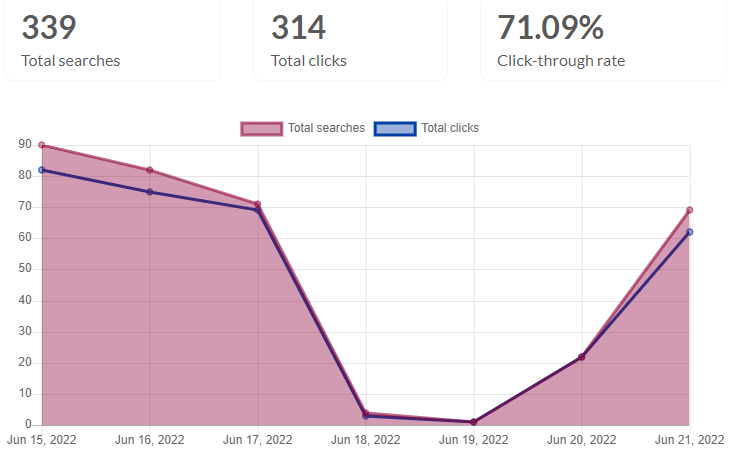
- Total searches - The number of searches in the selected timeframe.
A search session begins when you start searching, and ends when you click on a result or delete everything in your search bar. - Total clicks - The total number of search results clicked within the selected timeframe.
An individual search can lead to multiple clicks, so Total Clicks can be higher than Total searches. - Click-through rate (CTR) - The percentage of searches that led to at least one clicked result. This shows if your users are finding what
CTR is calculated as successful search sessions divided by total searches. - Successful searches (not shown in report) - The number of total searches that resulted in at least one search result click.
To calculate successful searches, multiply Total searches by CTR.
Apply filters to adjust the data visualization to specific sources, user types, timeframes, and keywords.
Why would a single search have multiple clicks?
This can depend on users' intentions. Some queries are research-based, in which users intend to read multiple documents to better understand different aspects of a particular subject. Although these types of queries can have multiple clicks, it does not necessarily reflect poor search result relevancy.
Example
Imagine you search 'new user' from the home page. You get the results and click into a result and get your answer. You have a click through rate of 100% (1 successful search / 1 total searches = 1 x 100 = 100%)
Now imagine you search 'new user' and you do not find the result you need. You remove everything in your search bar and search 'add a new user' and then you get a result and click on it. This gives you a CTR of 50% (1 successful search / 2 total searches = 0.5 x 100 = 50%)
Optimize your queries
Now that you have a high-level view of your search, learn how to analyze searches further to better understand your users and optimize your search performance.